
AI Security
Visibility
Graph Visualization
Entity Mapping
01
02
03
04
SOC Analyst
Primary user. Investigates the AI ecosystem daily - scans for new entities, traces connections, and identifies exposure across platforms, tools, and agents.
Key features
Explorable ecosystem map
Agent drill-down & relationships
Popover + side panel investigation
Job to be done
"See which AI entities exist, how they connect, and where exposure requires my attention."
CISO
Secondary user. Needs a quick high-level overview of organizational AI adoption and exposure without deep investigation.
Key features
Aggregated mini-dashboard
Platform & tool summary
Active users & exposed apps count
Job to be done
"Quickly understand our AI footprint and where the biggest risks are."
App SOC
Secondary user. Focused on specific applications - needs to see which AI tools and agents access their apps and what permissions they hold.
Key features
Filter by specific application
AI-to-app connection mapping
Permission and access details
Job to be done
"Show me which AI entities touch my app, what they can access, and whether that creates risk."

Competitor
What worked
What didn't work
Our advantage
Competitor X
Agent-centric graphs showing identity, credentials, permissions, and blast radius
Focused on a single agent's context- no organizational overview or cross-entity relationships
A complete ecosystem map connecting all AI entity types- not just one agent at a time
Competitor Y
Usage trends over time, sanctioned vs. unsanctioned classification, KPI-to-list navigation
Relied on dashboards and lists without a visual map showing how entities connect
Visual ecosystem map with entity relationships- not just metrics and lists
Competitor Z
Centralized agent lists with risk scoring, detail pages, and remediation actions
Optimized for comparability and scale, but no progressive drill-down from overview to investigation
Three-level navigation: organizational overview, ecosystem map, agent investigation


Interaction Design- Two levels of disclosure


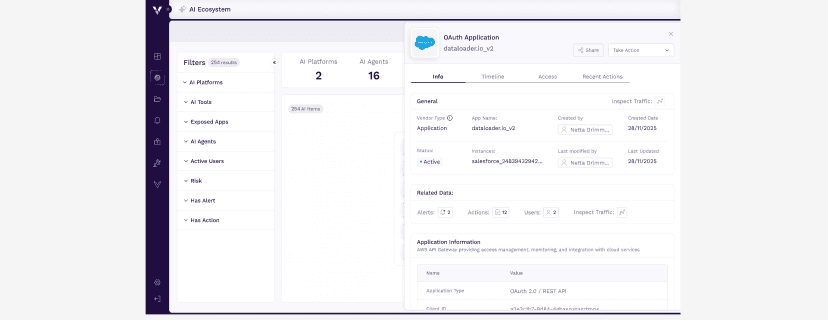


Add to Discovery
✕ Rejected
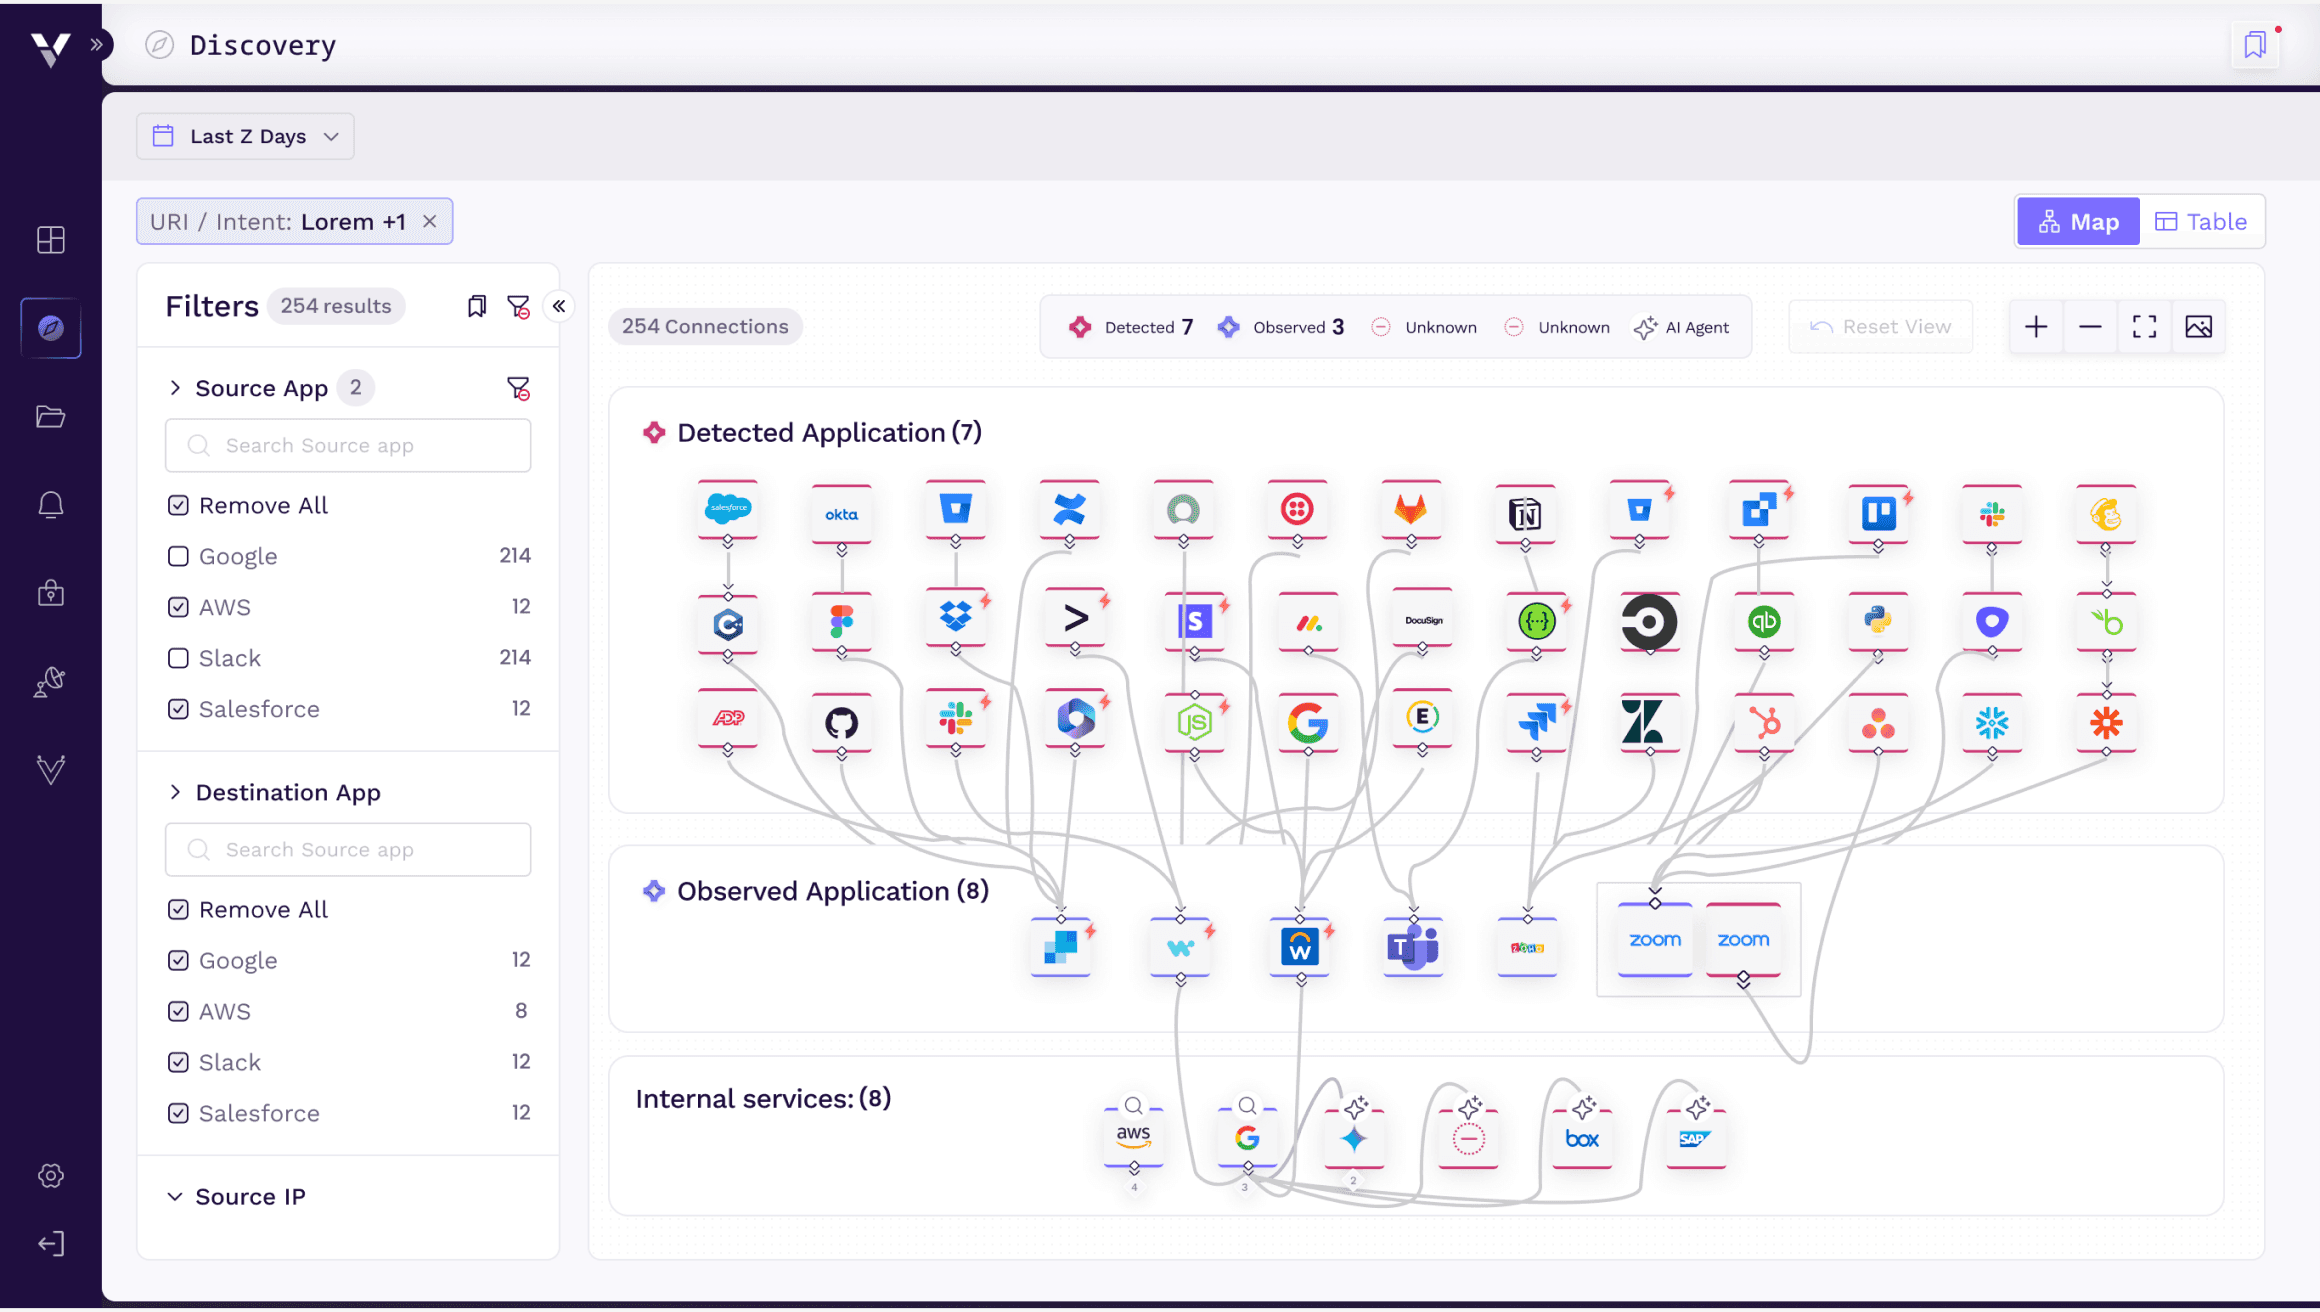
✓ Chosen - Phase 1


01
02
03
Entity Type Over Vendor
Platforms contain agents. Standalone tools appear together regardless of vendor. Users find tools by what they are, not who owns them.
Adaptive Layout
The map composition adjusts based on entity count and type. Fewer than 5 tools display vertically; larger ecosystems spread horizontally. Each edge carries semantic meaning.
Proximity & Similarity
Technically equivalent tools placed together are perceived as one category. Gestalt principles guided the spatial organization.

Users- Clear Security Model
Product- Competitive Advantage
Sales- Visual Demo Story
Gave Sales a visual, immediate way to communicate that Vorlon extended beyond SaaS monitoring to the broader AI ecosystem.
Business- AI Security Positioning
01
02
03
Show less when there's less to say
04
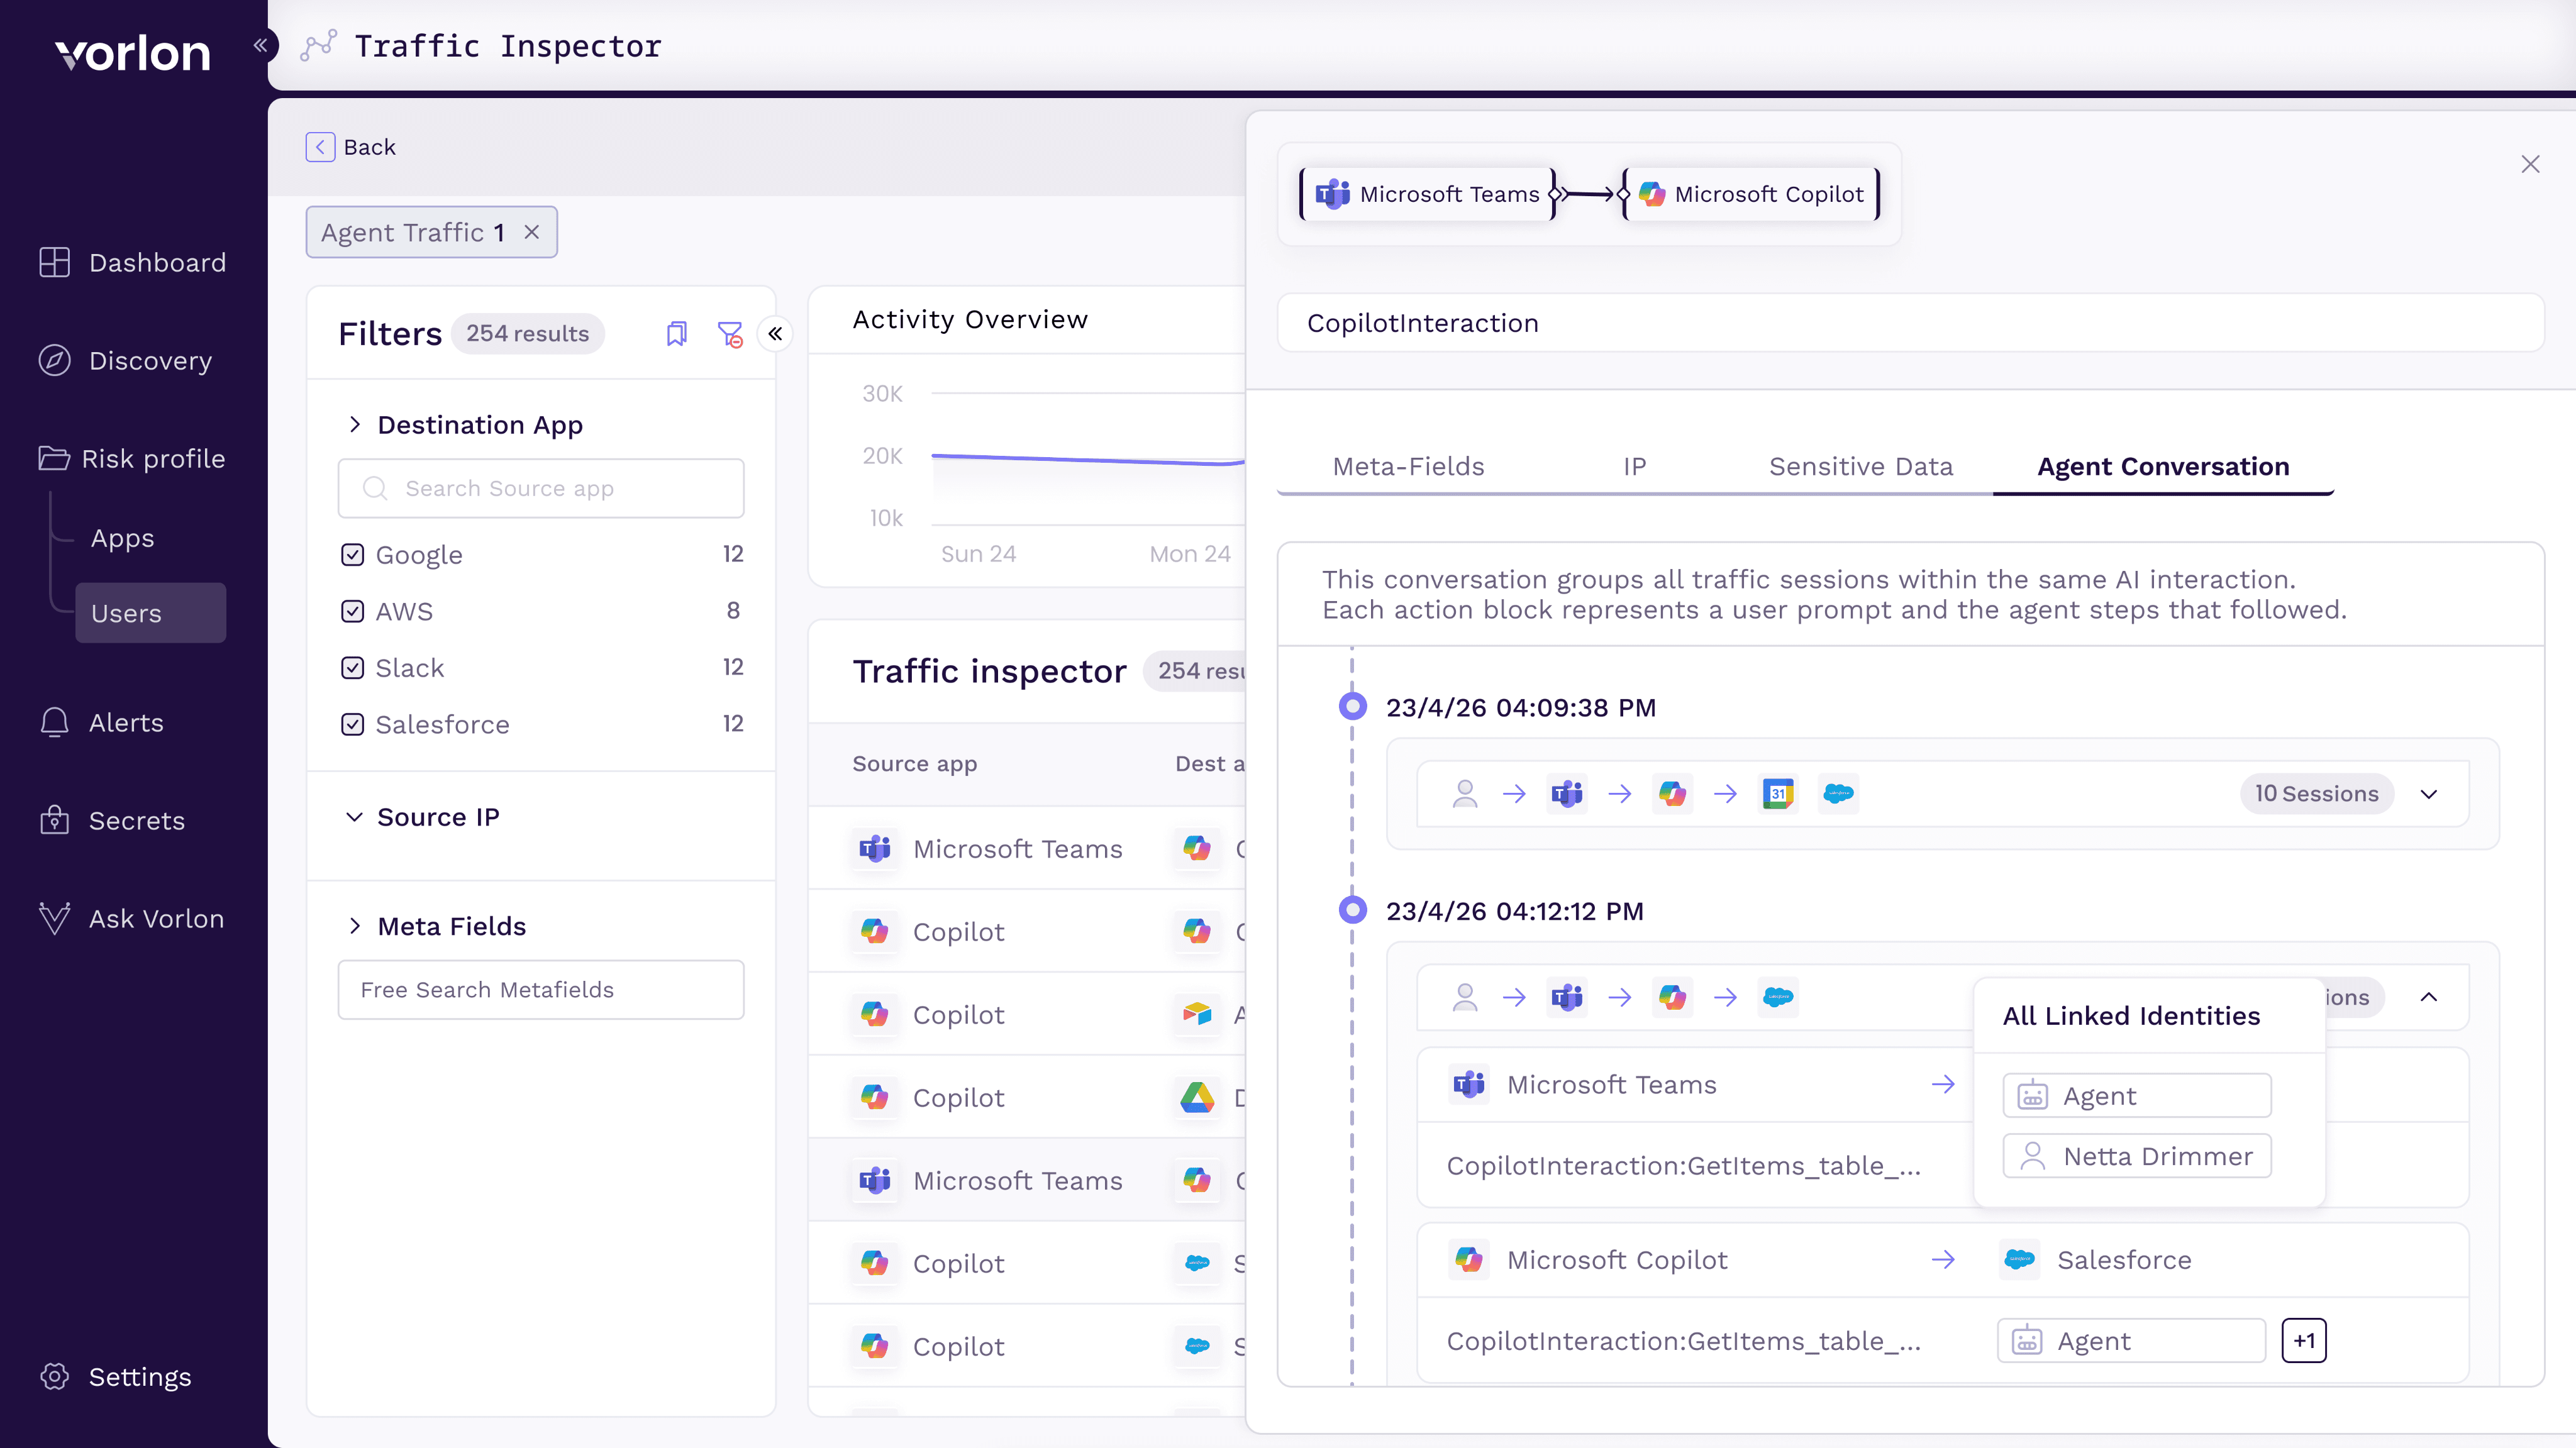
© 2026 Roni Lorentz